

Give the report a decision question
The dashboard has twelve charts, five colors and a respectable amount of movement.
The recommendation is “continue to monitor.”
Monitor what, exactly? For which decision? And what would have to happen before the team did something different?
Reporting should reduce uncertainty. When it only rearranges the numbers into a more attractive layout, the analyst has produced a presentation instead of a point of view.
State the question at the top. Define the reporting period and the inventory or audience context.
Explain any relevant change in collection methods, availability or campaign setup. Readers should not have to discover those qualifications after they have already formed a conclusion.
Choose a small set of measures that can inform the question. More metrics do not automatically provide a more complete explanation.
A carefully defined progression measure may be more useful than several activity charts if the team is investigating what happens after an inquiry.
This approach also makes missing information visible. If the report cannot answer the question with current records, say so.
Establishing the next data task can be a valid outcome, especially when the alternative is a confident recommendation based on incompatible numbers.
Do not promote a diagnostic into a business outcome
Activity, progression and outcome are connected, but they are not interchangeable. A platform score can help diagnose a specific issue while saying very little about whether the property solved its commercial problem.
Define the units and denominators. A conversion rate needs a clear numerator, denominator and observation window.
A scheduled appointment should not quietly substitute for a completed visit. When a report compares periods, confirm that definitions and tracking remained consistent.
Use cohort reporting when the question concerns a journey, where records allow it. Following inquiries from a defined period through later stages answers a different question from comparing all inquiries and all leases recorded during the same week.
Label the distinction clearly.
Keep attribution modest. A lease may involve several contacts and channels, alongside pricing, readiness and fit.
The dashboard can describe observed paths and support hypotheses without assigning the entire outcome to the last visible interaction.
The chart is evidence. The recommendation is your contribution.
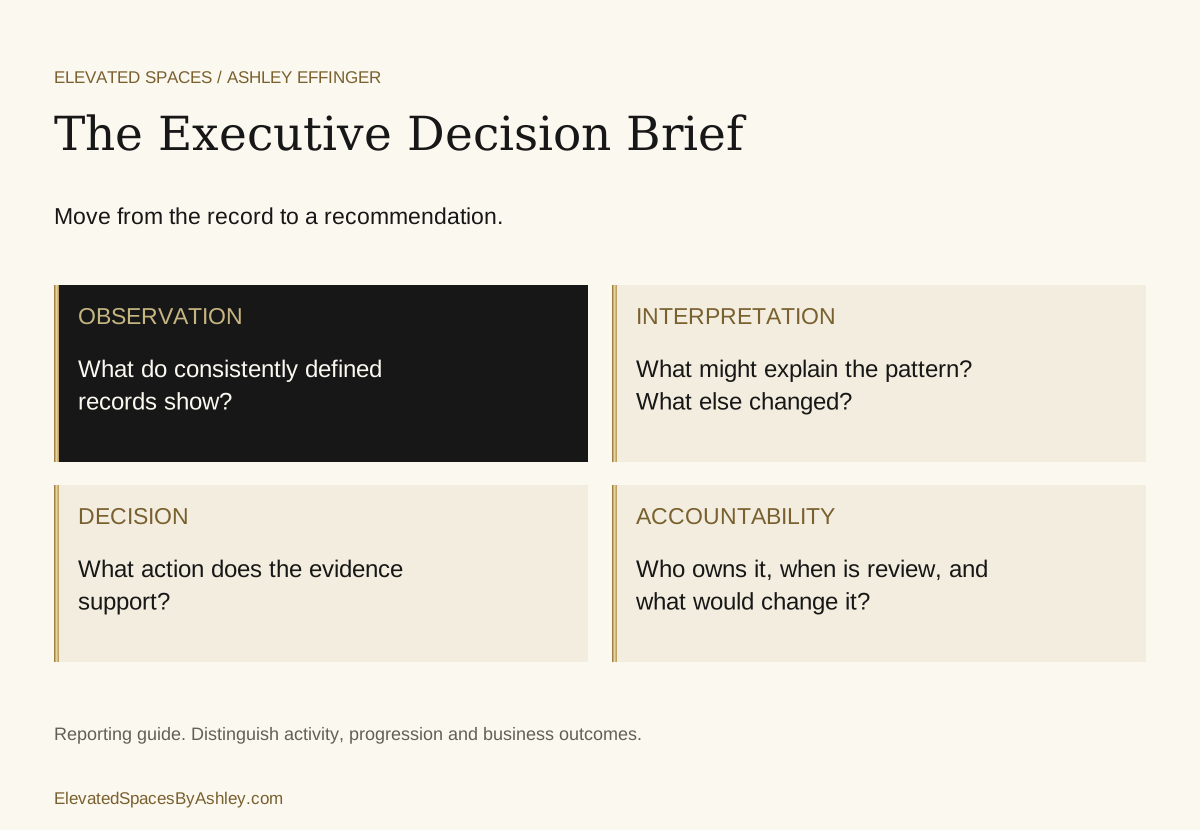
Read the framework as text
The Executive Decision Brief. OBSERVATION: What do consistently defined records show?. INTERPRETATION: What might explain the pattern? What else changed?. DECISION: What action does the evidence support?. ACCOUNTABILITY: Who owns it, when is review, and what would change it?
Explain the pattern and the competing explanation
Explain what the records show and what could also explain it. Availability, readiness, pricing and tracking changes belong beside the result. Confidence improves when the limits are visible.
Use direct operating context from leasing and the property team. Recurring questions, unavailable homes and delayed answers can explain patterns a channel dashboard cannot.
Keep those observations separate from measured results so readers can assess their different evidentiary weight.
An illustrative report might show more inquiries and fewer completed tours. The next step is to inspect appointment definitions, timing and handoffs before declaring the campaign successful or unsuccessful.
The same headline can arise through several different processes.
If the available sample is small, state the uncertainty in ordinary language. The report should help the team decide what to investigate or improve next, rather than imply a precision the underlying records cannot support.
Put a name and a date on the recommendation
The Executive Marketing Performance Brief should finish with an action, an owner, a review date and a condition for reconsidering. If those lines are missing, the dashboard has not finished its job.
For example, the team might correct a landing-page mismatch, standardize a stage definition or prepare a clearer comparison for a difficult layout. Each action addresses an observed question.
“Optimize performance” does not establish who should change what.
Record what would make the team reconsider. A change in inventory, new evidence or an unresolved tracking issue can alter the recommendation.
Keeping that condition visible makes the review process more disciplined and less dependent on defending the previous slide deck.
The planned Executive Marketing Performance Brief will structure this short narrative. You can begin with three paragraphs today: what the records show, what remains uncertain and what the team should do next.
If the dashboard does not support those paragraphs, revise the reporting question before adding another chart.
Multifamily Marketing KPI Dictionary
Agree on what the metric counts before interpreting the result or deciding the next action.
Get the KPI DictionaryRelated published work
Continue with Ashley’s original articles. This website companion focuses on practical implementation.
- PPC Clicks Don’t Lease Apartments. Alignment Does. · Elevated Spaces on LinkedIn